Oceanic expansion model
-

-
Designed by Jeulin

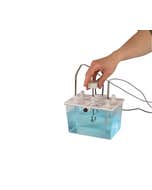
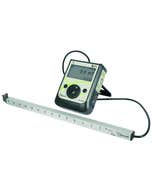
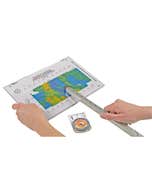
Measure with a teslameter the variations in the value of the magnetic field of a model of the ocean floor.
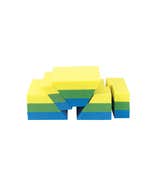
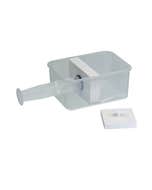
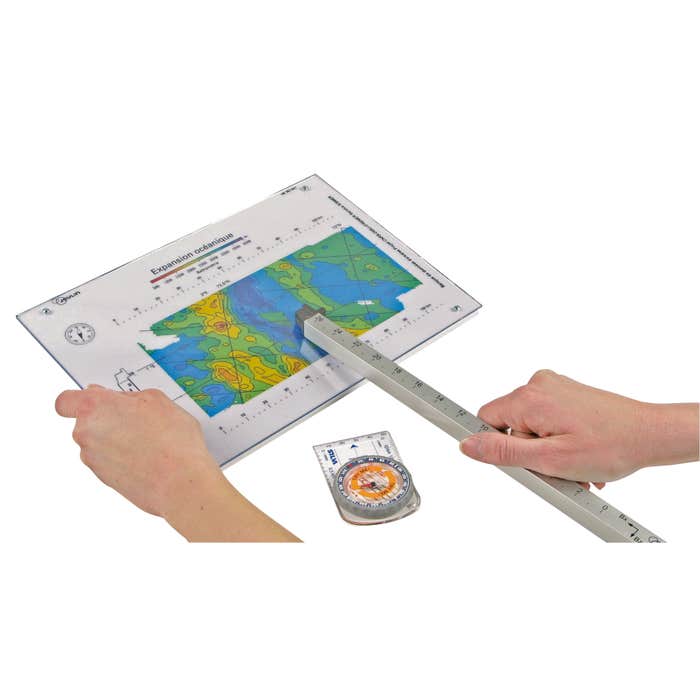
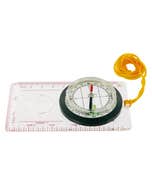
The model consists of a plate representing a bathymetric map of the ocean floor near a ridge. Magnets placed in the model simulate the magnetic field reversals corresponding to the represented region (verifiable with a compass).
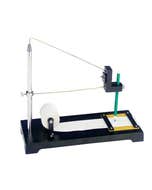
By moving the teslameter along a central line, the student measures and graphs the variations in the magnetic field value as a function of the distance traveled along the ocean floor.
Two transverse paths across the ridge allow for obtaining two profiles and thus reconstruct the bands of magnetic anomalies. A map of the magnetic anomalies in this same area is available for download in the Documentation tab.
The step-by-step experiment:
① Preparation of the model: Place the model, which represents a bathymetric map of the ocean floor, on a flat surface. Insert the magnets into the designated slots to simulate the magnetic field reversals.
② Placement of the teslameter probe: Position the teslameter probe at the first measurement marker, following the central lines of the model.
③ Measurement of magnetic values: Move the teslameter probe along the path, taking a measurement of the magnetic field every 5 mm. Record the values obtained for each point.
④ Plotting the magnetic profile: On a graph, plot the measurements to create a magnetic profile. This profile will allow visualization of the magnetic anomalies associated with the reversals of the Earth's magnetic field.
⑤ Profile analysis: Compare the magnetic bands on either side of the ridge. Use the scale of magnetic reversals to calculate the rate of oceanic expansion.
The set includes:
- A4-sized model
- Bathymetric map accompanied by a depth scale
| Dimensions (L x l x H) | 21 × 29,7 cm |
- In stock
- In stock
- In stock
- In stock
-
There are 58 product(s) left in stock

- In stock
- In stock
- In stock
- In stock
-
In stock

- In stock
- In stock
-
In stock

-
In stock
-
In stock

- In stock
-
In stock
-
In stock

- In stock
- In stock
- In stock
- In stock