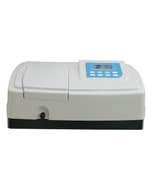
M.Wave Professional Analysis Software (Single-user Version)
This analysis software allows you to perform: QUANTITATIVE ANALYSIS: - Coefficient method: If you know the coefficients of a curve's formula, you can save them directly and the curve will appear on the screen. You can then measure an unknown sample using the curve. - Creating a curve with standard samples: You can use up to 20 standard samples to create a new curve. You have 3 options to define the curve: linear, square, or cubic. KINETICS: You can choose the time interval (0.5, 1.0, 2.0, 5.0, 10.0, 30.0, or 60.0 seconds). You can choose different photometric modes to display the curve (Transmission-Time and Absorbance-Time). WAVELENGTH SCANNING: You can save and download the baseline system. You can choose the scanning interval (0.1, 0.2, 0.5, 1.0, 2.0, and 5.0 nm). You can choose different photometric modes to display the spectrum (Wavelength-Transmission, Wavelength-Absorbance, and Wavelength-Energy). Automatically lists spectrum peaks. Spectrum processes (+, -, *, /, derivative, and smooth). MULTI-WAVELENGTH TEST: You can program up to 20 wavelengths to measure a sample. DNA/PROTEIN TEST: You can choose between the two methods and save the coefficients yourself. Necessary conditions: Pentium or higher computer CD-ROM drive USB port 32MB memory (256MB or more is highly recommended) 50MB or more hard drive Microsoft Windows 2000 or Windows XP Software to be used with spectrophotometer ref. 701 604
| Vendu par | À l'unité |
| Type d'accessoires | Logiciel |


